
|
Unit 1
Statistical Questions |

|

|

|
|

|
|
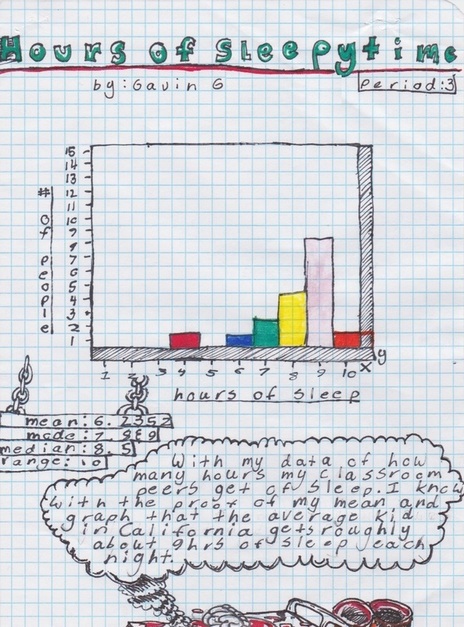
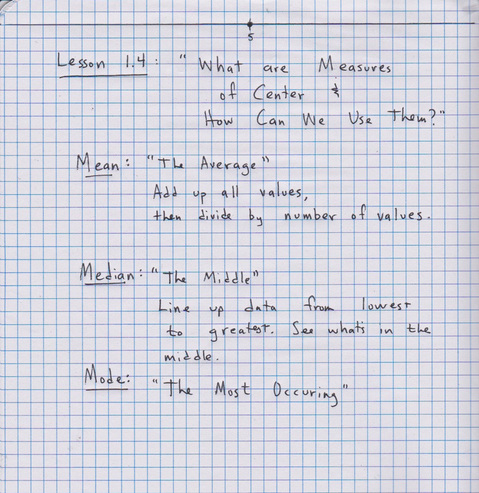
When you have a distribution of numbers, it helps to use a central number to describe all of the numbers. If we look at Gavin's Histogram from Lesson 1.1, we may want to know how many hours the average middle school student gets. What numbers exist at the center of our data?
To do this, we look at three Measures of Central Tendency: the Mean, the Median, and the Mode. The Mean (the average): What do you get when I add up all the values and divide by the number of values? The Median (the middle number): What number is in the exact middle of the values? The Mode (the most occurring): Which value occurs the most? |
|
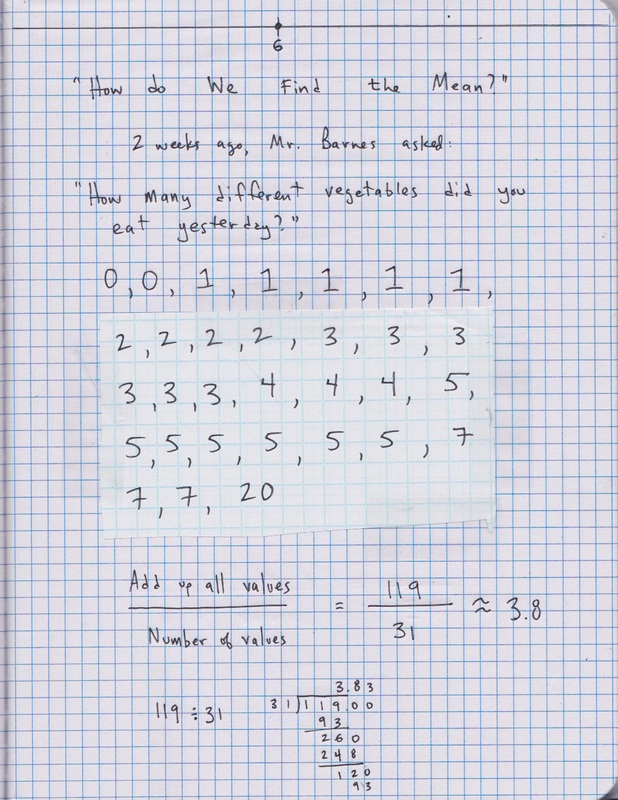
Last week, I asked both of my 6th grade classes,
"How many different kinds of vegetables did you eat yesterday?"
These were my findings:
"How many different kinds of vegetables did you eat yesterday?"
These were my findings:
What if I wanted to communicate my results in a single central number? I have three different choices: The mean, the median and the mode.
Notebook:
|
|
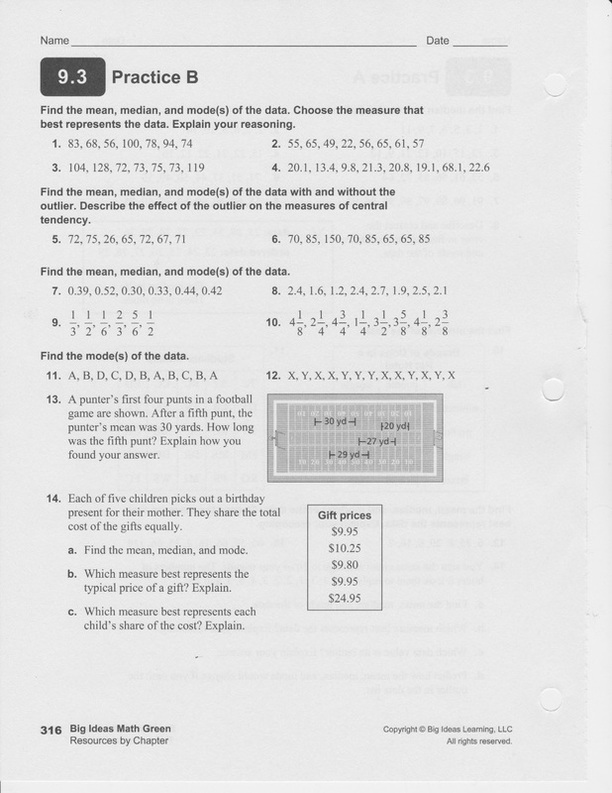
Classwork & Homework:
Do problems 1, 2, 3, 5 and 13. Click here for answers.
California Standards:
CCSS.Math.Practice.MP3 Construct viable arguments and critique the reasoning of others.
CCSS.Math.Practice.MP5 Use appropriate tools strategically.
CCSS.Math.Content.6.NS.B.2
Fluently divide multi-digit numbers using the standard algorithm.
CCSS.Math.Content.6.SP.A.2
Understand that a set of data collected to answer a statistical question has a distribution which can be described by its center, spread, and overall shape.
CCSS.Math.Content.6.SP.A.3
Recognize that a measure of center for a numerical data set summarizes all of its values with a single number, while a measure of variation describes how its values vary with a single number.
CCSS.Math.Content.6.SP.B.5
Summarize numerical data sets in relation to their context, such as by:
CCSS.Math.Content.6.SP.B.5.a
Reporting the number of observations.
CCSS.Math.Content.6.SP.B.5.b
Describing the nature of the attribute under investigation, including how it was measured and its units of measurement.
CCSS.Math.Content.6.SP.B.5.c
Giving quantitative measures of center (median and/or mean) and variability (interquartile range and/or mean absolute deviation), as well as describing any overall pattern and any striking deviations from the overall pattern with reference to the context in which the data were gathered.
CCSS.Math.Content.6.SP.B.5.d
Relating the choice of measures of center and variability to the shape of the data distribution and the context in which the data were gathered.
