
|
Unit 1:
Functions Lesson 1.4 |

|

|

|
|

|

|
There are many different types of functions.
In Algebra 1, but we will be looking closely at these four:
In Algebra 1, but we will be looking closely at these four:
Notebook:
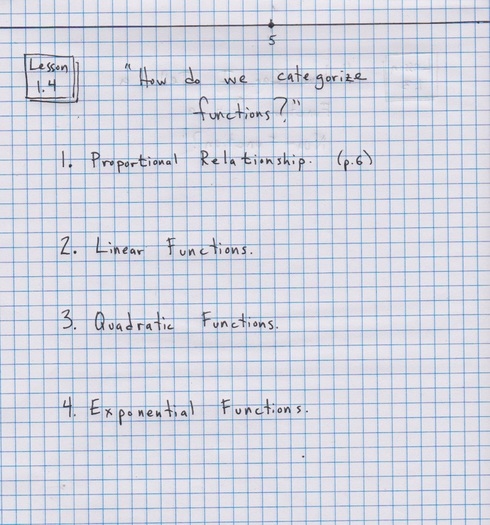
Page 6 in your INB: A Proportional Relationship.
Flip!
Page 7 in your INB: A Linear Function.
Flip!
Page 8 in your INB: A Quadratic Function.
Flip!
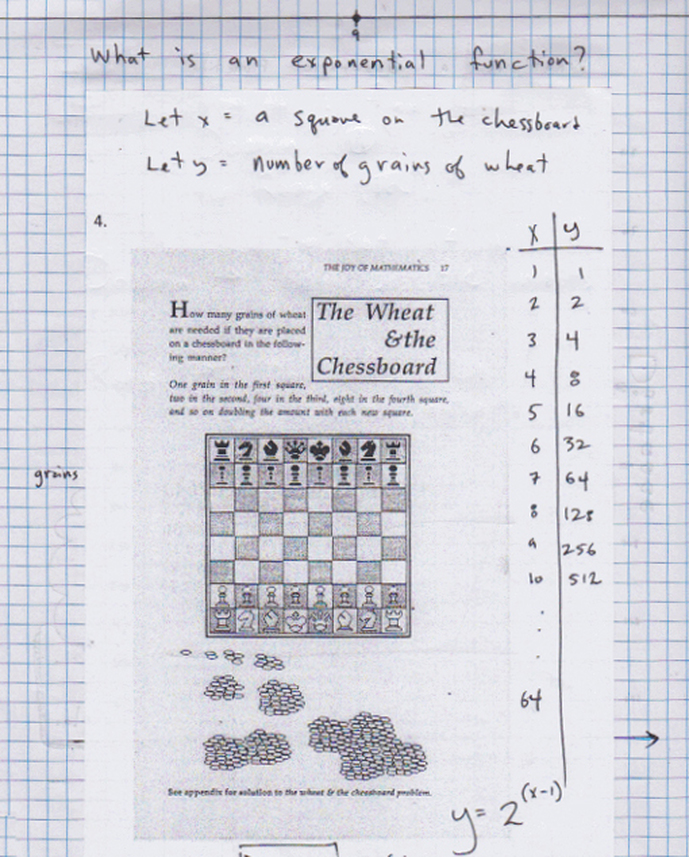
Page 9 in your INB: An exponential function.
Flip!
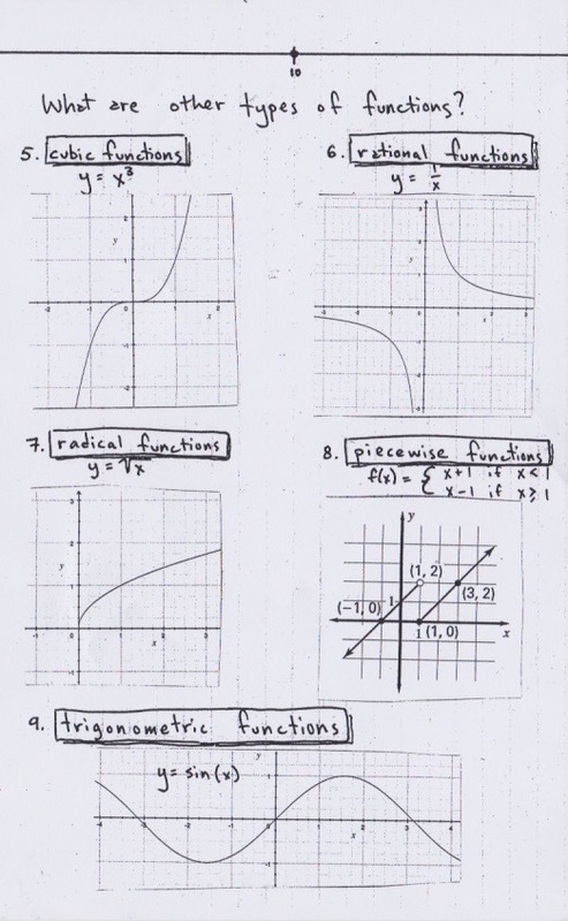
Page 10 in your INB: Algebra 2 Functions. This was given out in class.
California Standards:
Define, evaluate, and compare functions.
CCSS.Math.Content.8.F.A.1
Understand that a function is a rule that assigns to each input exactly one output. The graph of a function is the set of ordered pairs consisting of an input and the corresponding output.
CCSS.Math.Content.8.F.A.2
Compare properties of two functions each represented in a different way (algebraically, graphically, numerically in tables, or by verbal descriptions). For example, given a linear function represented by a table of values and a linear function represented by an algebraic expression, determine which function has the greater rate of change.
CCSS.Math.Content.8.F.A.3
Interpret the equation y = mx + b as defining a linear function, whose graph is a straight line; give examples of functions that are not linear. For example, the function A = s2 giving the area of a square as a function of its side length is not linear because its graph contains the points (1,1), (2,4) and (3,9), which are not on a straight line. Use functions to model relationships between quantities.
CCSS.Math.Content.8.F.B.5
Describe qualitatively the functional relationship between two quantities by analyzing a graph (e.g., where the function is increasing or decreasing, linear or nonlinear). Sketch a graph that exhibits the qualitative features of a function that has been described verbally.
