|
Unit 1:
Functions Lesson 1.2 |

|
|

|

|

|

|
You can put any real number into a function. Each input creates an output. There are as many outputs as inputs you can create. Infinite inputs, infinite outputs.
In order to create an overall picture of a function, we often graph the relationship between the input and the output.
What does the function do? we ask. Is it increasing? Decreasing? Staying the same? Does it increase or decrease at a steady rate? Does it end? Does it work for any input or does the function break down?
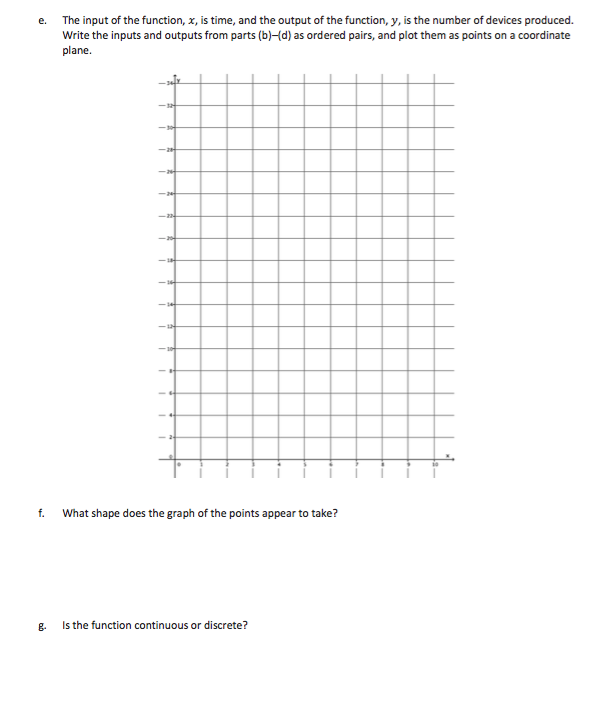
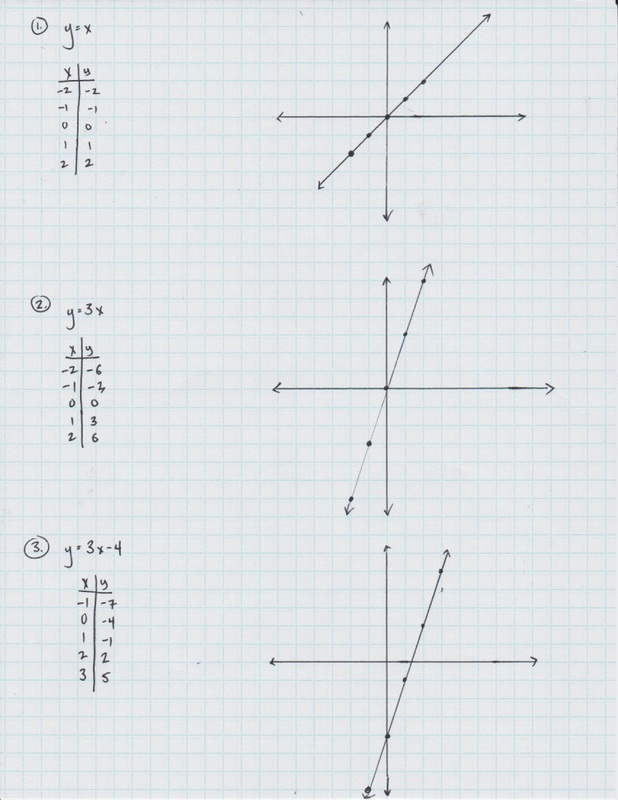
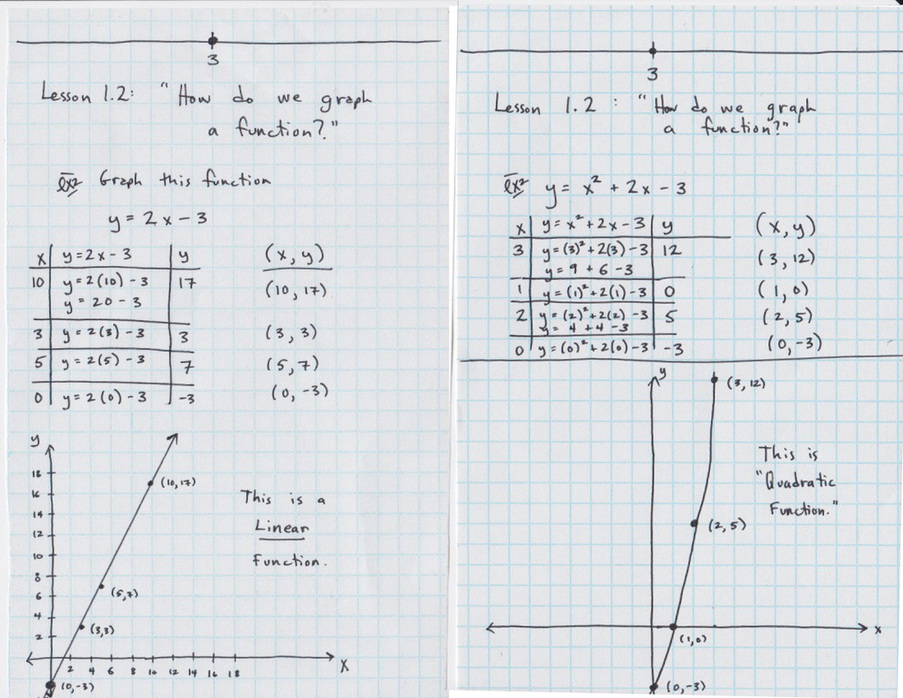
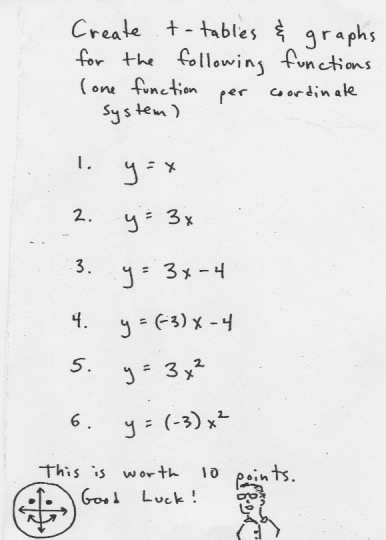
To graph a function, we choose some inputs and make a t-table. We then graph the ordered pairs (x, y) on the graph. We then have an overall picture of what this function does.
In order to create an overall picture of a function, we often graph the relationship between the input and the output.
What does the function do? we ask. Is it increasing? Decreasing? Staying the same? Does it increase or decrease at a steady rate? Does it end? Does it work for any input or does the function break down?
To graph a function, we choose some inputs and make a t-table. We then graph the ordered pairs (x, y) on the graph. We then have an overall picture of what this function does.
Notebook:
Classwork & Homework:
See the bottom for the answers.