
|
Unit 1
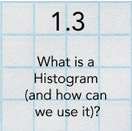
Statistical Questions |

|

|
|

|

|
Intro:
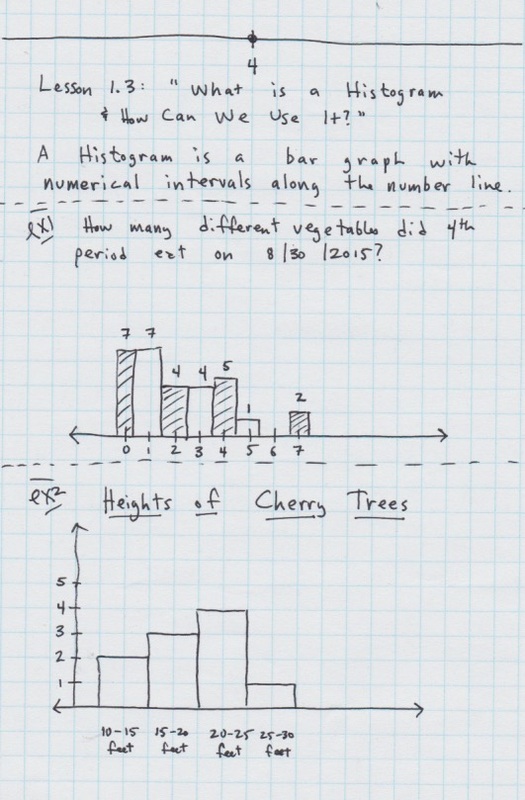
A histogram is a bar graph that shows the distribution of numbers. Histograms are used frequently to display statistics. Histograms have numbers or intervals along a horizontal number line.
Last year, Ella asked the statistical question, "How many siblings do you have?" She made a histogram of her findings.
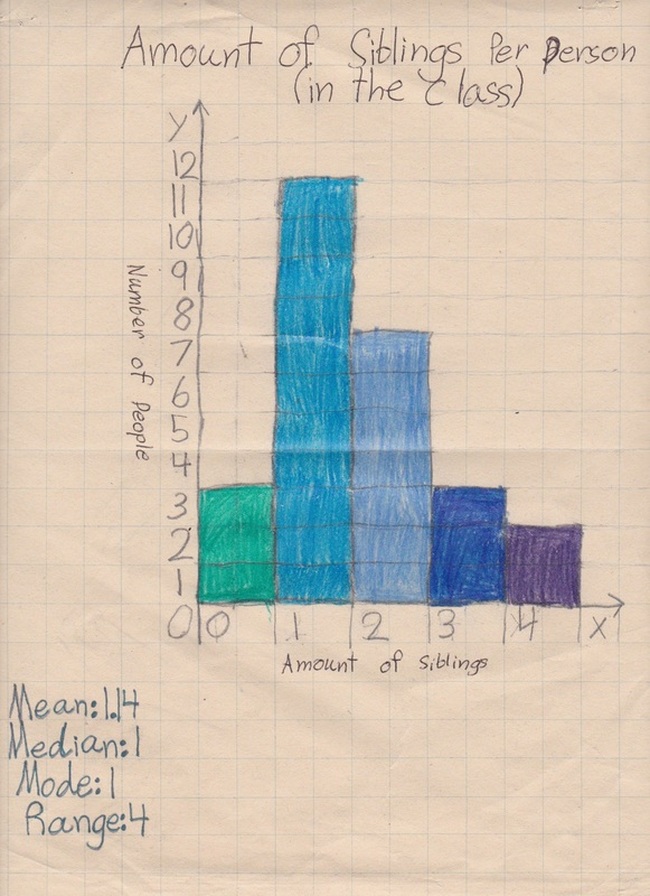
How would you describe her findings?
As you can see, a histogram is a bar graph that has numbers along the horizontal axis, or x-axis.
Here is another histogram from that shows intervals of data:
As you can see, a histogram is a bar graph that has numbers along the horizontal axis, or x-axis.
Here is another histogram from that shows intervals of data:
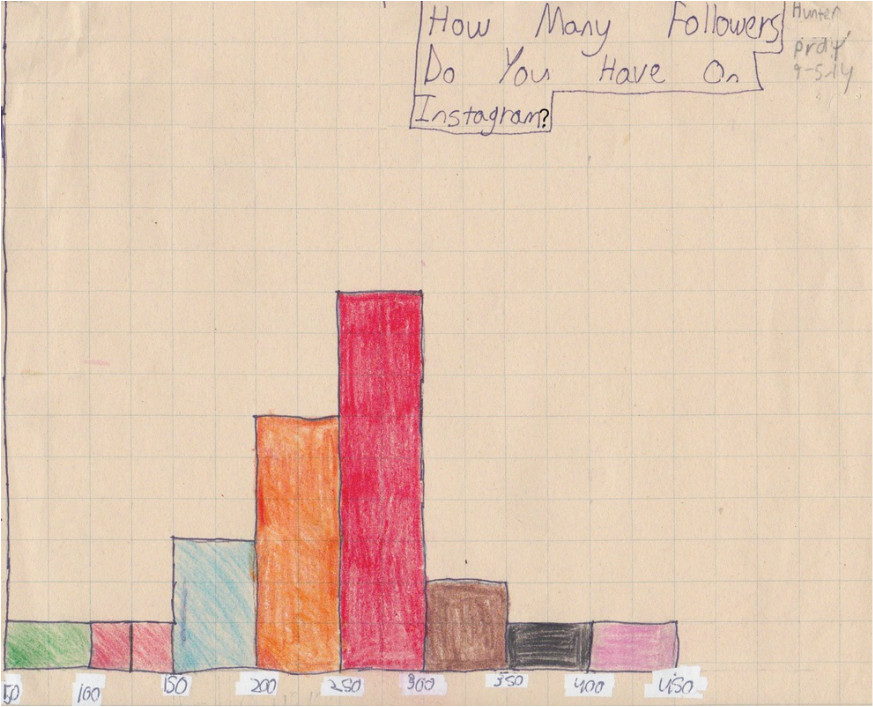
Why do you think Hunter decided to go with intervals of data instead of individual pieces of data?
Notebook:
Classwork & Homework:
--Big Ideas
California Standards:
CCSS.Math.Practice.MP4 Model with mathematics.
CCSS.Math.Practice.MP5 Use appropriate tools strategically.
CCSS.Math.Content.6.SP.A.2
Understand that a set of data collected to answer a statistical question has a distribution which can be described by its center, spread, and overall shape.
CCSS.Math.Content.6.SP.B.4
Display numerical data in plots on a number line, including dot plots, histograms, and box plots.
CCSS.Math.Content.6.SP.B.5
Summarize numerical data sets in relation to their context, such as by:
CCSS.Math.Content.6.SP.B.5.a
Reporting the number of observations.
CCSS.Math.Content.6.SP.B.5.b
Describing the nature of the attribute under investigation, including how it was measured and its units of measurement.
CCSS.Math.Content.6.SP.B.5.d
Relating the choice of measures of center and variability to the shape of the data distribution and the context in which the data were gathered.
